
基于Python深度图生成3D点云
文章目录
前言
废话不多说,直接开造。这里的话我们有两个目标,第一个是如何把一个2维图片上的点映射到3维空间。第二就是如何生成3D点云。当然实际上这是一个大问题,因为只要解决了第一个问题,第二个问题就是“送分”
二维RGB图像
在说到3D点云之前我们就不得不说到RGB图像,也就是一些二维图像。
图像以像RGB三个通道的形式进行存储。也就是这样:

平时我们看到的就是左边的2D图像,实际上是以右边的形式存储的。
那么从我们的矩阵角度来看的话,大概是这个样子的:
[
[[r,g,b],[r,g,b],[r,g,b],[r,g,b]],
[[r,g,b],[r,g,b],[r,g,b],[r,g,b]],
...

]
这里面存在了两组信息,
第一组就是我们最容易忽略的位置信息,也就是像素点的位置。
第二组就是我们的色彩信息。
显然如果我们想要生成3D点云的话,我们的色彩信息是必要的。
而位置信息,在二维平面上,是在3为空间上的映射
那么要想得到3D点云,那么我们就必须得到完整的位置坐标,也就是x,y,z
成像原理
那么说到这里的话,我们就不得不说到,摄像机是如何把咱们的影像映射出来的了。
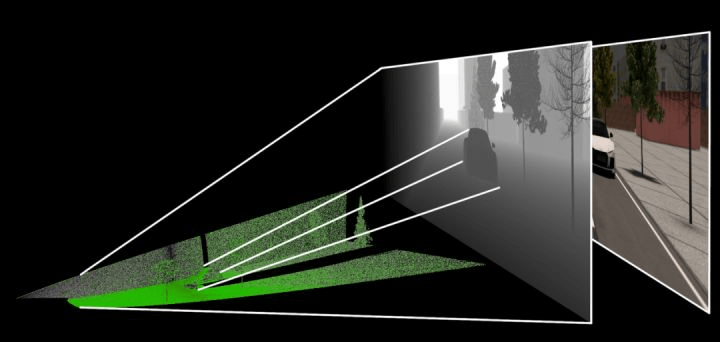
大概他是这样成像的:
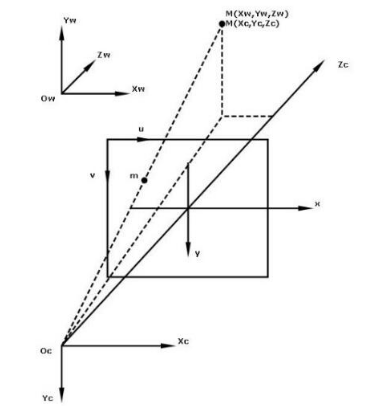
这里咱们有三个东西需要注意一下。
首先是我们的摄像机位置
之后是相片的位置也就是中间那个
最后是我们物品实际位置
所以我们实际上的一个二维图像,就是一个投影,在实际上的话,我们可以理解为深度为1的空间。
但是这个投影
所以的话,用数学矩阵的形式表示为:
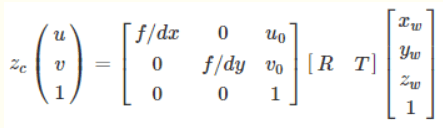
其中u,v为二维平面上的任意点坐标,1为深度,Zc就是咱们的二维平面上的点。
其中R,T是外参矩阵,并且我们的世界坐标原点就是相机的坐标原点
所以,R,T可以取下面的矩阵,(具体原理的话比较复杂,我也不是很懂为什么会这样,我回头再补补数学)
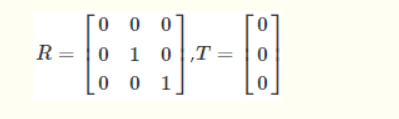
带入得到:
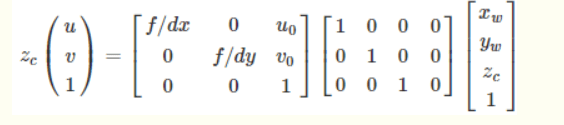
最后转换得到这个公式:
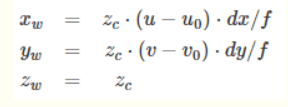
那么接下来咱们就对这个公式进行处理,来生成我们的点云
数据准备
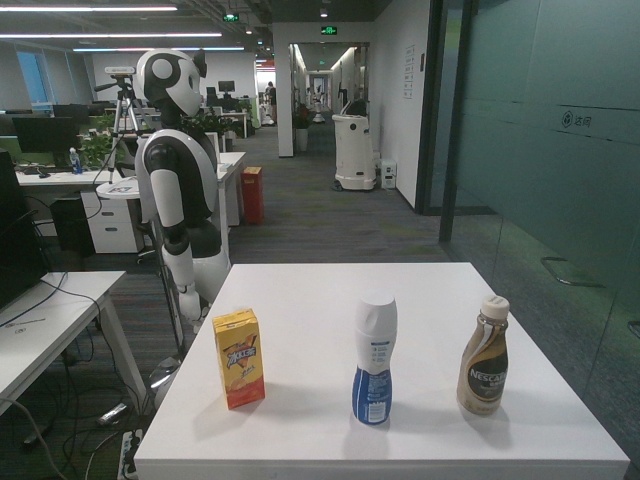
前面通过公式我们可以了解到,一个二维图像,具备了RGB信息,还有对应的那个像素点在二维空间的“投影”。我们需要将这个点重新还原到三维空间。所以这里需要使用到深度信息,而这个是需要一些专业摄像机才有的,比如iphone的,或者机器人的:

有了这个深度图片,我们就可以还原坐标了。其实说到这儿,我们其实可以发现,RGB图片的话其实只是提供了一下色彩如果要还原为3D点云的话,因为深度图和对应的rgb的矩阵的位置是一一对应的。
图片加载
说到这里,我们就可以开始我们的正式编码了。
首先是咱们的图片加载阶段,这里的话主要是我们先需要一些信息,和读取图片。
    def __init__(self, rgb_file, depth_file, save_ply, camera_intrinsics=[784.0, 779.0, 649.0, 405.0]):
        self.rgb_file = rgb_file
        self.depth_file = depth_file
        self.save_ply = save_ply

        self.rgb = cv2.imread(rgb_file)
        self.depth = cv2.imread(self.depth_file, -1)

        print("your depth image shape is:",self.depth.shape)

        self.width = self.rgb.shape[1]
        self.height = self.rgb.shape[0]

        self.camera_intrinsics = camera_intrinsics
        self.depth_scale = 1000
下面的这个东西,就是咱们公式当中的u0,v0,dx,dy
camera_intrinsics=[784.0, 779.0, 649.0, 405.0]
这个要注意的是,这个玩意呢,是不同的设备相机有不同的参数,要根据自己的设置。
一般来说相机会给这样的矩阵:
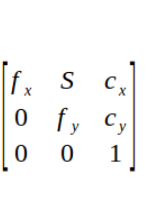
我们对应起来就可以了。
之后是要注意的是这个深度图是uint16的,所以读取的时候加个-1

这里还有个东西:
深度图与比例因子(scale_factor)
在代码中是:
self.depth_scale = 1000
深度图对应的尺度因子是深度图中存储的值与真实深度(单位为m)的比例
通常情况下,深度值以毫米为单位存储在16位无符号整数中(0~65535),因此要获得以米为单位的z值,深度图的像素需要除以比例因子1000。不过不同相机的的比例因子可能不同,我这里的话是1000,这个看自己的实际的。
算法实现
之后就是咱们的算法实现了,这个主要是位置换算,得到真实的x,y,z
        depth = np.asarray(self.depth, dtype=np.uint16).T
        # depth[depth==65535]=0
        self.Z = depth / self.depth_scale
        fx, fy, cx, cy = self.camera_intrinsics

        X = np.zeros((self.width, self.height))
        Y = np.zeros((self.width, self.height))
        for i in range(self.width):
            X[i, :] = np.full(X.shape[1], i)

        self.X = ((X - cx / 2) * self.Z) / fx
        for i in range(self.height):
            Y[:, i] = np.full(Y.shape[0], i)
        self.Y = ((Y - cy / 2) * self.Z) / fy
之后,x,y,z就算好了。
注意的的是我们计算完成后得到的x,y , x 的每一组向量都是 宽×高
生成点云
现在咱们已经得到了具体的坐标。那么接下来是要生成点云的,我们要把剩下的色彩信息搞上去。
代码很简单:
    data_ply = np.zeros((6, self.width * self.height))
        data_ply[0] = self.X.T.reshape(-1)
        data_ply[1] = -self.Y.T.reshape(-1)
        data_ply[2] = -self.Z.T.reshape(-1)
        img = np.array(self.rgb, dtype=np.uint8)
        data_ply[3] = img[:, :, 0:1].reshape(-1)
        data_ply[4] = img[:, :, 1:2].reshape(-1)
        data_ply[5] = img[:, :, 2:3].reshape(-1)
        self.data_ply = data_ply
        t2 = time.time()
        print('calcualte 3d point cloud Done.', t2 - t1)
之后就是保存文件了。
目前点云的主要存储格式包括:pts、LAS、PCD、.xyz 和. pcap 等
例如:
pts 点云文件格式是最简便的点云格式,直接按 XYZ 顺序存储点云数据, 可以是整型或者浮点型。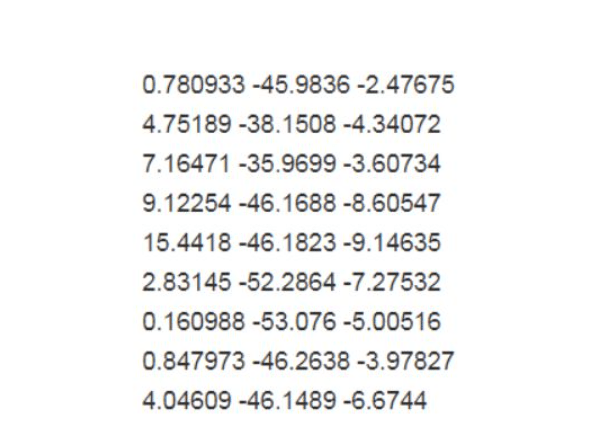
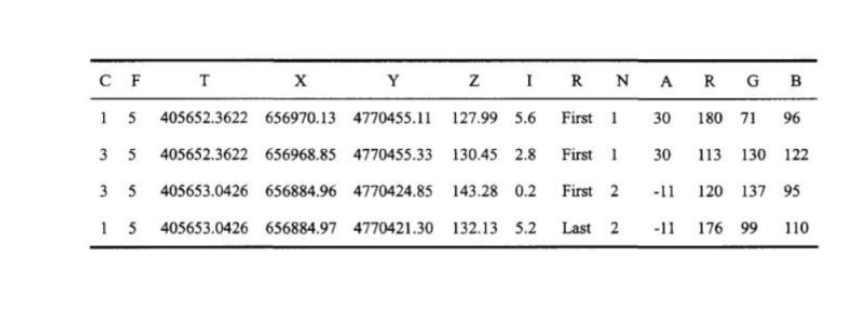
LAS 是激光雷达数据(LiDAR),存储格式比 pts 复杂,旨在提供一种开放的格式标准,允许不同的硬件和软件提供商输出可互操作的统一格式。LAS 格式点云截图,其中 C:class(所属类),F:flight(航线号),T:time(GPS 时间),I:intensity(回波强度),R:return(第几次回波),N:number of return(回波次数),A:scan angle(扫描角),RGB:red green blue(RGB 颜色值)。
等等,我们这里的是ply
全名为多边形档案(Polygon File Format)或 史丹佛三角形档案(Stanford Triangle Format)。. 该格式主要用以储存立体扫描结果的三维数值,透过多边形片面的集合描述三维物体,与其他格式相较之下这是较为简单的方法。. 它可以储存的资讯包含颜色、透明度、表面法向量、材质座标与资料可信度,并能对多边形的正反两面设定不同的属性。
格式为
头部
顶点列表
面片列表
其他元素列表

       	start = time.time()
        float_formatter = lambda x: "%.4f" % x
        points = []
        for i in self.data_ply.T:
            points.append("{} {} {} {} {} {} 0\n".format
                          (float_formatter(i[0]), float_formatter(i[1]), float_formatter(i[2]),
                           int(i[3]), int(i[4]), int(i[5])))

        file = open(self.save_ply, "w")
        file.write('''ply
        format ascii 1.0
        element vertex %d
        property float x
        property float y
        property float z
        property uchar red
        property uchar green
        property uchar blue
        property uchar alpha
        end_header
        %s
        ''' % (len(points), "".join(points)))
        file.close()

        end = time.time()
        print("Write into .ply file Done.", end - start)
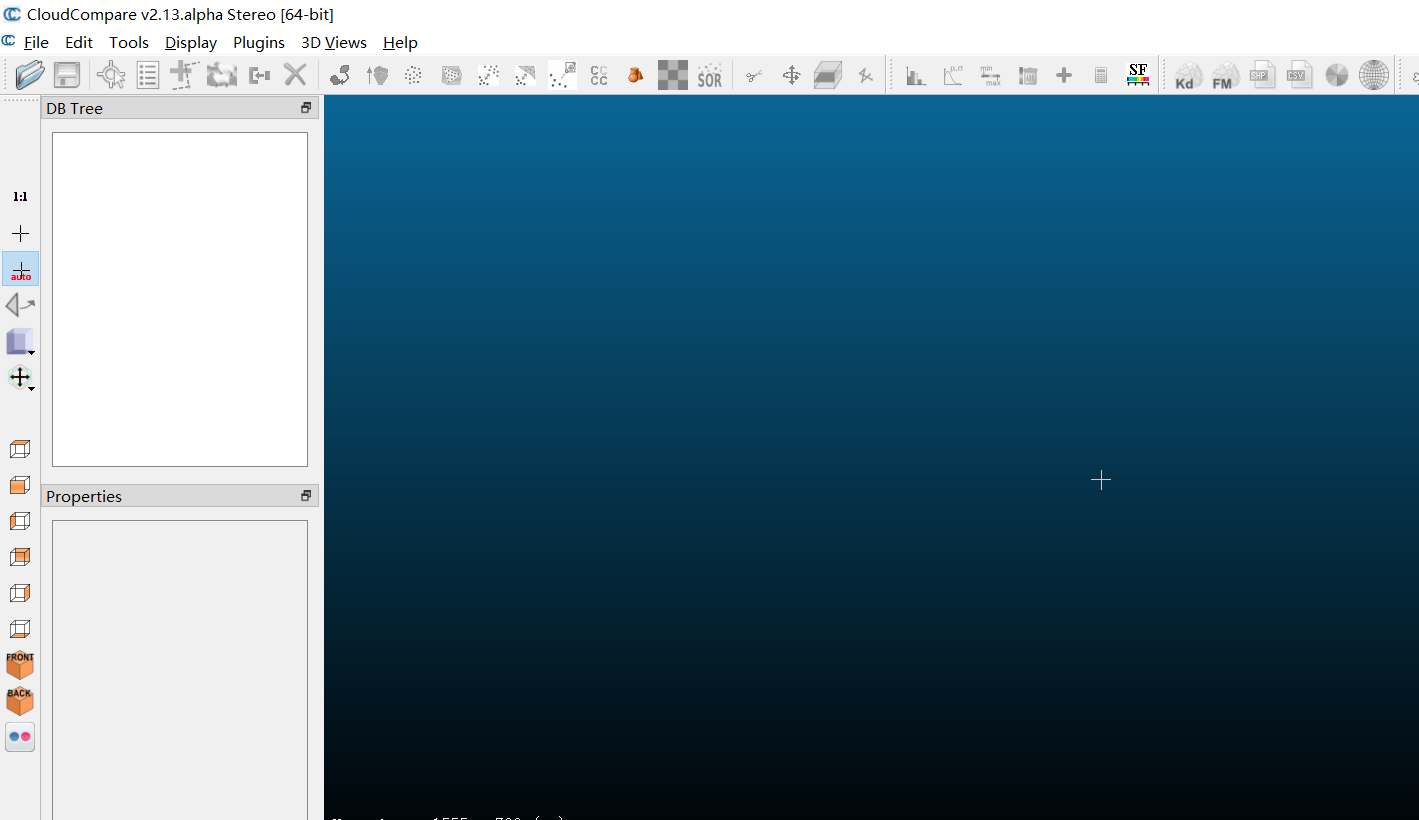
点云显示
这个的话可以使用软件
也可以使用open3d模块
完整代码
import cv2
import numpy as np
import open3d as o3d

import time


class point_cloud_generator():

    def __init__(self, rgb_file, depth_file, save_ply, camera_intrinsics=[784.0, 779.0, 649.0, 405.0]):
        self.rgb_file = rgb_file
        self.depth_file = depth_file
        self.save_ply = save_ply

        self.rgb = cv2.imread(rgb_file)
        self.depth = cv2.imread(self.depth_file, -1)

        print("your depth image shape is:",self.depth.shape)

        self.width = self.rgb.shape[1]
        self.height = self.rgb.shape[0]

        self.camera_intrinsics = camera_intrinsics
        self.depth_scale = 1000

    def compute(self):
        t1 = time.time()

        depth = np.asarray(self.depth, dtype=np.uint16).T
        # depth[depth==65535]=0
        self.Z = depth / self.depth_scale
        fx, fy, cx, cy = self.camera_intrinsics

        X = np.zeros((self.width, self.height))
        Y = np.zeros((self.width, self.height))
        for i in range(self.width):
            X[i, :] = np.full(X.shape[1], i)

        self.X = ((X - cx / 2) * self.Z) / fx
        for i in range(self.height):
            Y[:, i] = np.full(Y.shape[0], i)
        self.Y = ((Y - cy / 2) * self.Z) / fy

        data_ply = np.zeros((6, self.width * self.height))
        data_ply[0] = self.X.T.reshape(-1)
        data_ply[1] = -self.Y.T.reshape(-1)
        data_ply[2] = -self.Z.T.reshape(-1)
        img = np.array(self.rgb, dtype=np.uint8)
        data_ply[3] = img[:, :, 0:1].reshape(-1)
        data_ply[4] = img[:, :, 1:2].reshape(-1)
        data_ply[5] = img[:, :, 2:3].reshape(-1)
        self.data_ply = data_ply
        t2 = time.time()
        print('calcualte 3d point cloud Done.', t2 - t1)

    def write_ply(self):
        start = time.time()
        float_formatter = lambda x: "%.4f" % x
        points = []
        for i in self.data_ply.T:
            points.append("{} {} {} {} {} {} 0\n".format
                          (float_formatter(i[0]), float_formatter(i[1]), float_formatter(i[2]),
                           int(i[3]), int(i[4]), int(i[5])))

        file = open(self.save_ply, "w")
        file.write('''ply
        format ascii 1.0
        element vertex %d
        property float x
        property float y
        property float z
        property uchar red
        property uchar green
        property uchar blue
        property uchar alpha
        end_header
        %s
        ''' % (len(points), "".join(points)))
        file.close()

        end = time.time()
        print("Write into .ply file Done.", end - start)

    def show_point_cloud(self):
        pcd = o3d.io.read_point_cloud(self.save_ply)
        o3d.visualization.draw([pcd])


if __name__ == '__main__':
    camera_intrinsics = [378.998657, 378.639862, 321.935120, 240.766663]
    rgb_file = "data/1.jpg"
    depth_file = "data/1.png"
    save_ply = "data.ply"
    a = point_cloud_generator(rgb_file=rgb_file,
                              depth_file=depth_file,
                              save_ply=save_ply,
                              camera_intrinsics=camera_intrinsics
                              )
    a.compute()
    a.write_ply()
    a.show_point_cloud()
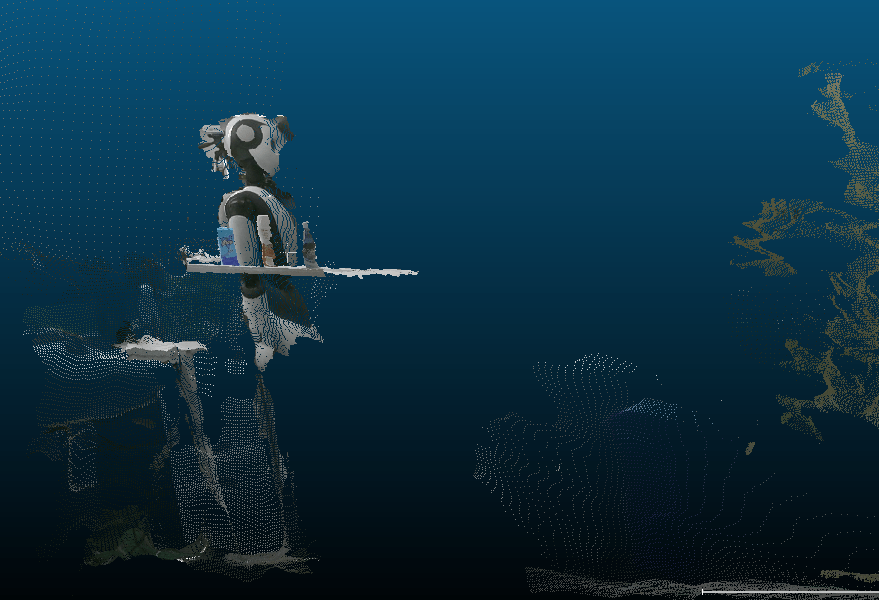
效果如下:
总结
这里的话其实还是从一张深度图到3d点云,实际上有时候我们可能只需一组坐标然后还原,那么这部分的话,要实现的话也不难,不过要重新做一点转换,公式还是那个公式。这里的话就不能在多说了,而且这里还有一点值得一提的是这个通过这种方式得到的3d点云其实怎么说呢,并不是特别准,所以这边还是要更加牛批的人工智能算法的,目前有个集成玩意可以玩玩的是middlepipe。这方面的话Google还是得是他。


